

Ranking the Top 50 US Cities for Stay at Home Compliance using Public WiFi
We have all seen the impacts of CV-19 and experienced the required “stay at home” mitigation. Some cities have been more compliant than others regarding the stay at home requirements. Although not all cities have a stay at home implementation, it’s interesting to compare the 50 top US cities and see which have been the most effective.
One way to measure this effectiveness is to look at session data from public WiFi locations. Most public hotspot locations with free public WiFi were selected due to the fact that people tended to congregate at these sites. Changes in the amount of sessions can serve as an informal indicator for decreases in public traffic at these locations.
Courtesy of the anonymized session count data provided by Denis Sklyarov CEO and the team at WiFi Map, we looked at session counts from the top 50 US cities for Feb, March, and April (data was inclusive until 4/22 and estimated for the last 8 days of the month). WiFi Map has over 100 million accessible free WiFi locations in its worldwide database.
Using the anonymized session data, we developed trend lines for the negative changes as a result of the CV-19 stay at home mandates. Figure #1 highlights the 5 largest US cities.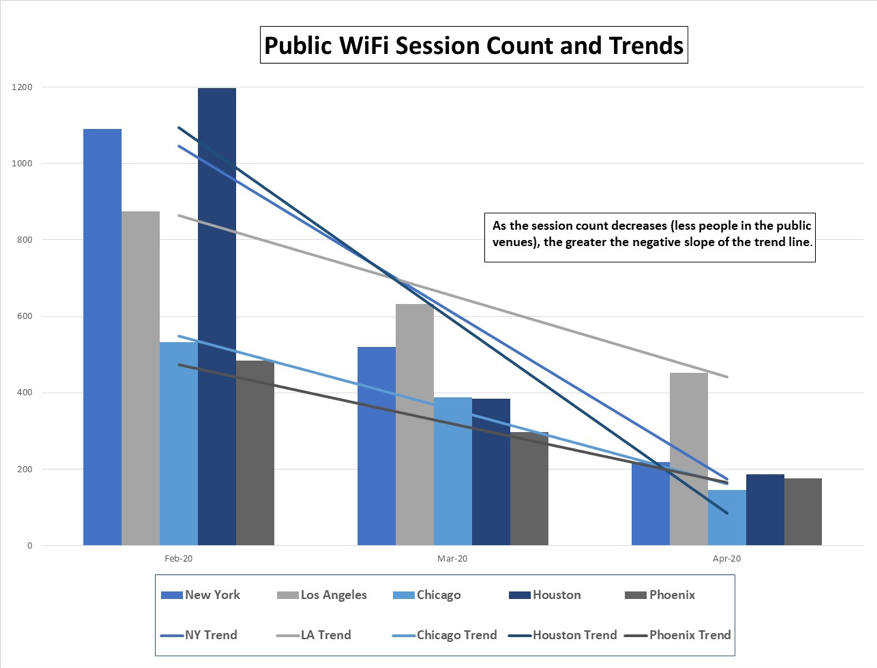
Figure #1
As you can see. all the cities experienced a major decline in session counts with Houston having the steepest drop (highest negative slope).
Using this same methodology, we developed trend lines for all of the top 50 US cities. Fig #2 compares the Top 5 cities for the most session decrease change and the Bottom 5 cites for the least session decrease change.
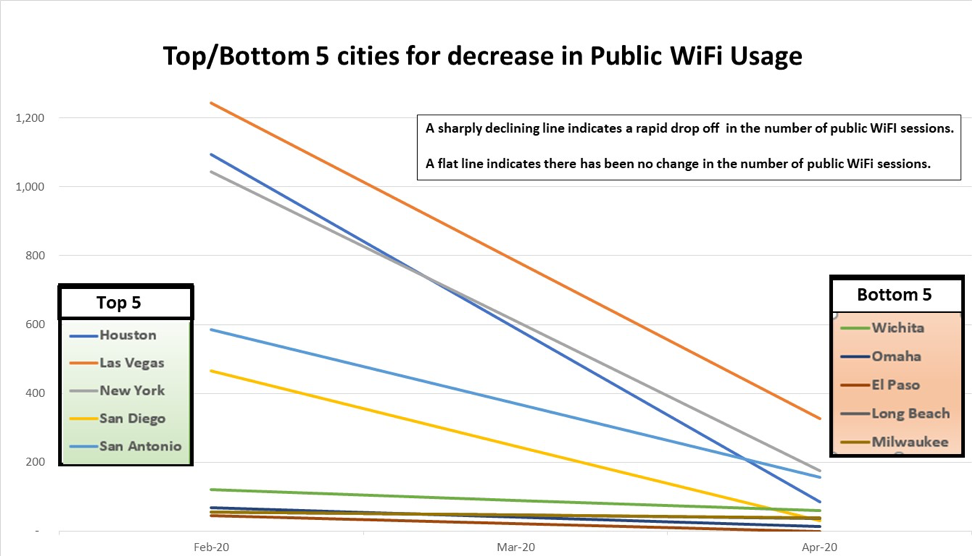
Figure #2
As you can see, Houston, Las Vegas and New York experienced the greatest change during this period. El Paso, Long Beach, and Milwaukee experienced little change in reporting public WiFi locations.
Looking at the top 50 US cities, we developed a trend line for each one. Using this trend line, we computed the slope of this trend line. The higher the “negative” slope value, the greater the decrease in the number of sessions per month. A slope of zero would indicate no change in the number of sessions over the 3-month period. Fortunately, all cities did have some degree of decrease. Figure #3 stack ranks the largest 50 US cities by negative slope.
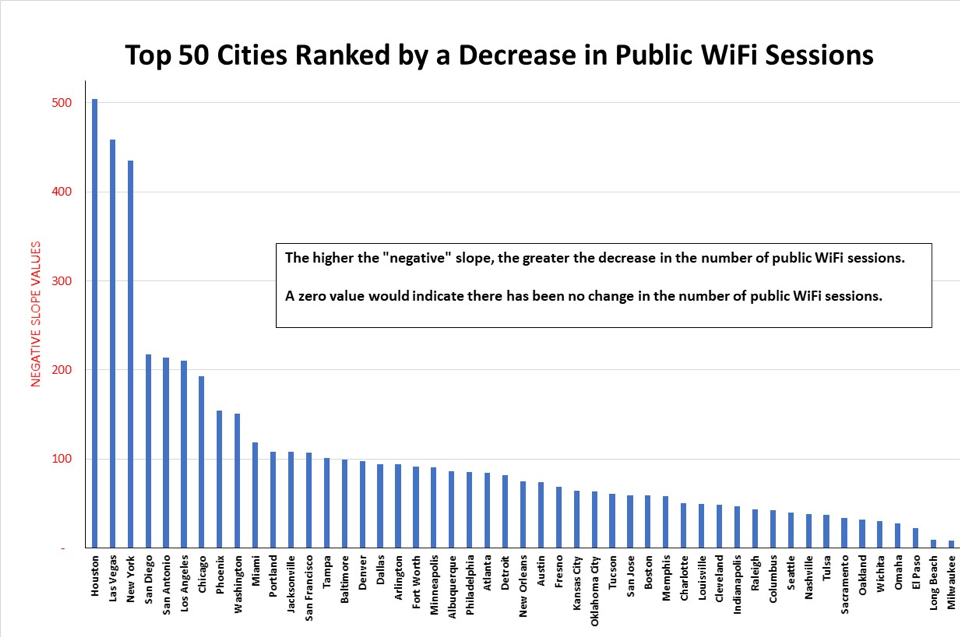
Figure #3
The data suggests that some cities have been more compliant with the stay at home directive than others. Certainly, there are many other factors that impact the stay at home compliance but it’s interesting to use this data as a potential means of comparing cities. Cell phone usage is certainly a more extensive way to analyze the impacts, but this information can also help provide another view.
Ron Angerame is an independent WiFi consultant. He can be reached at ron.angerame@gmail.com
Denis Sklyarov is CEO at WIFI Map. He can be reached at den@wifimap.io. To learn more about WiFi Map go to wifimap.io.